

We have covered body composition methodologies on DN previously HERE, HERE, and HERE.
Today, we are going scorched earth on bioimpedance-based body composition data. DEXA is also going to catch some strays. They all will.
You will need to go to the site for the presentation or interactive charts to work. They will not work inside of the email.
Downloadable audio HERE
| Device | Population | Measure | SEM / RMS SD | LSC (95%) | Author (year) |
|---|---|---|---|---|---|
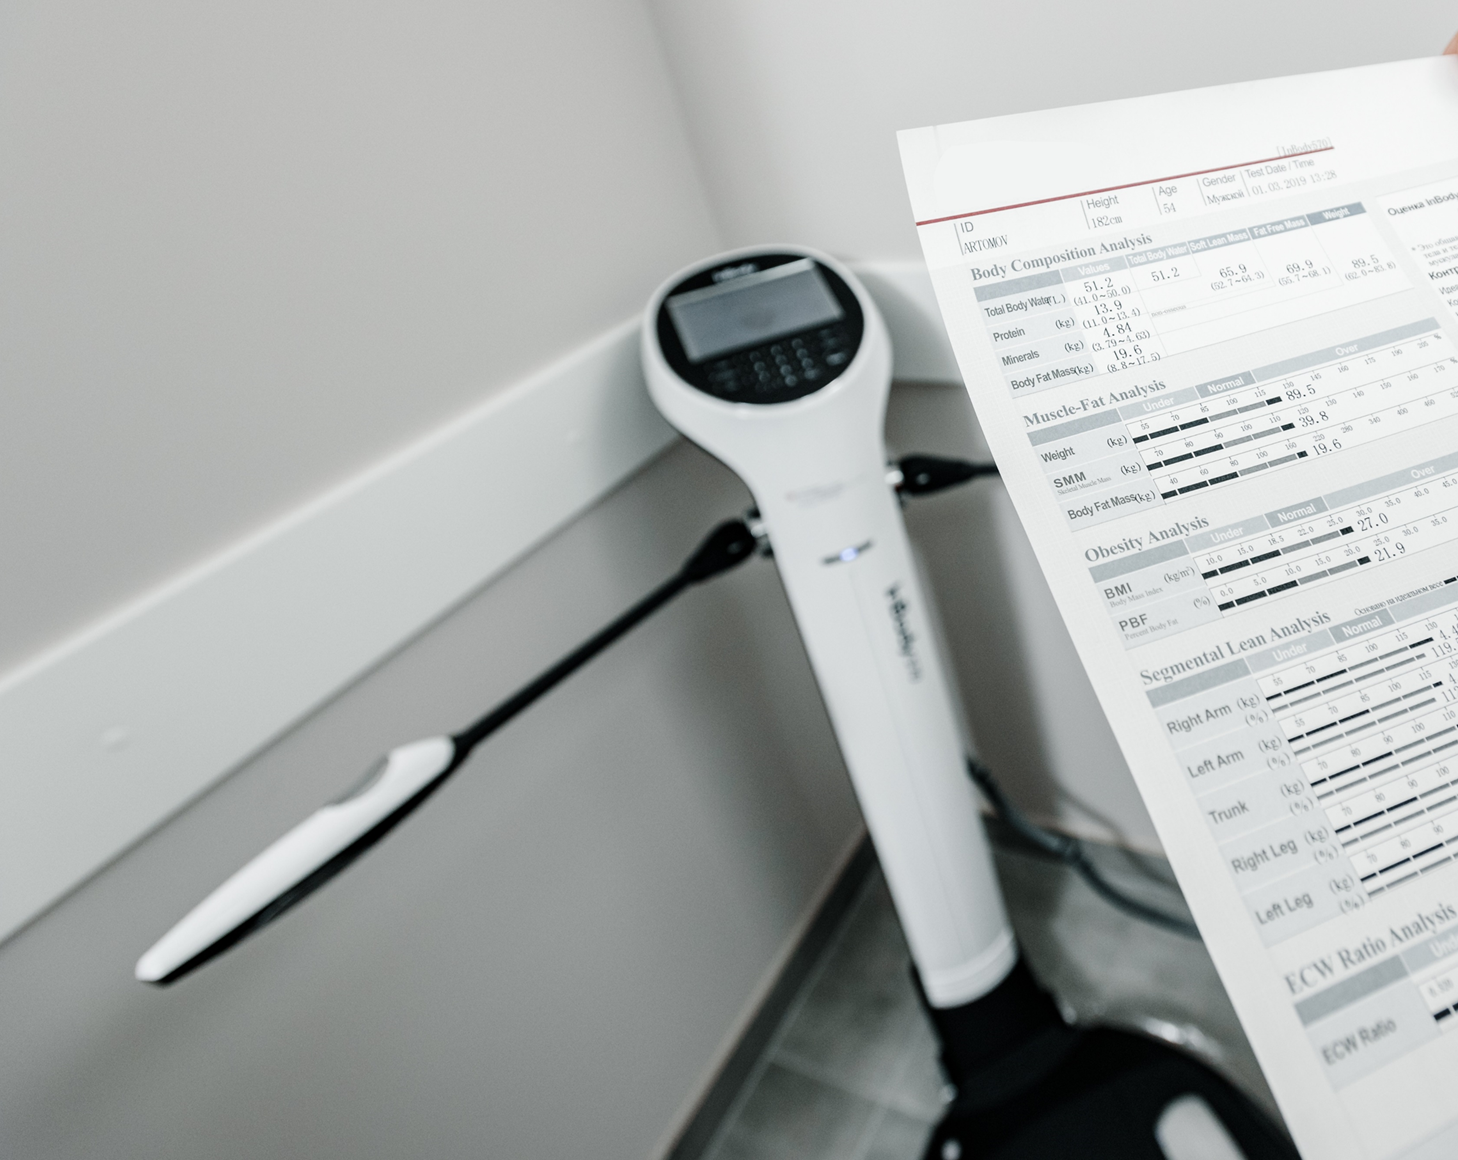
| InBody 770 | Healthy adults, n=67 | %BF | SEM 0.77% | 2.13% | Nickerson (2020) |
| InBody 770 | Healthy adults | FM | SEM 0.54 kg | 1.50 kg | Nickerson (2020) |
| InBody 770 | Healthy adults | FFM | SEM 0.58 kg | 1.61 kg | Nickerson (2020) |
| InBody 370S | Healthy adults, n=67 | %BF | SEM 0.99% | 2.73% | Nickerson (2020) |
| InBody 370S | Healthy adults | FM | SEM 0.87 kg | 2.41 kg | Nickerson (2020) |
| InBody 370S | Healthy adults | FFM | SEM 0.84 kg | 2.32 kg | Nickerson (2020) |
| InBody 230 | Healthy adults, n=67 | %BF | SEM 0.82% | 2.27% | Nickerson (2020) |
| InBody 230 | Healthy adults | FM | SEM 0.59 kg | 1.63 kg | Nickerson (2020) |
| InBody 230 | Healthy adults | FFM | SEM 0.62 kg | 1.72 kg | Nickerson (2020) |
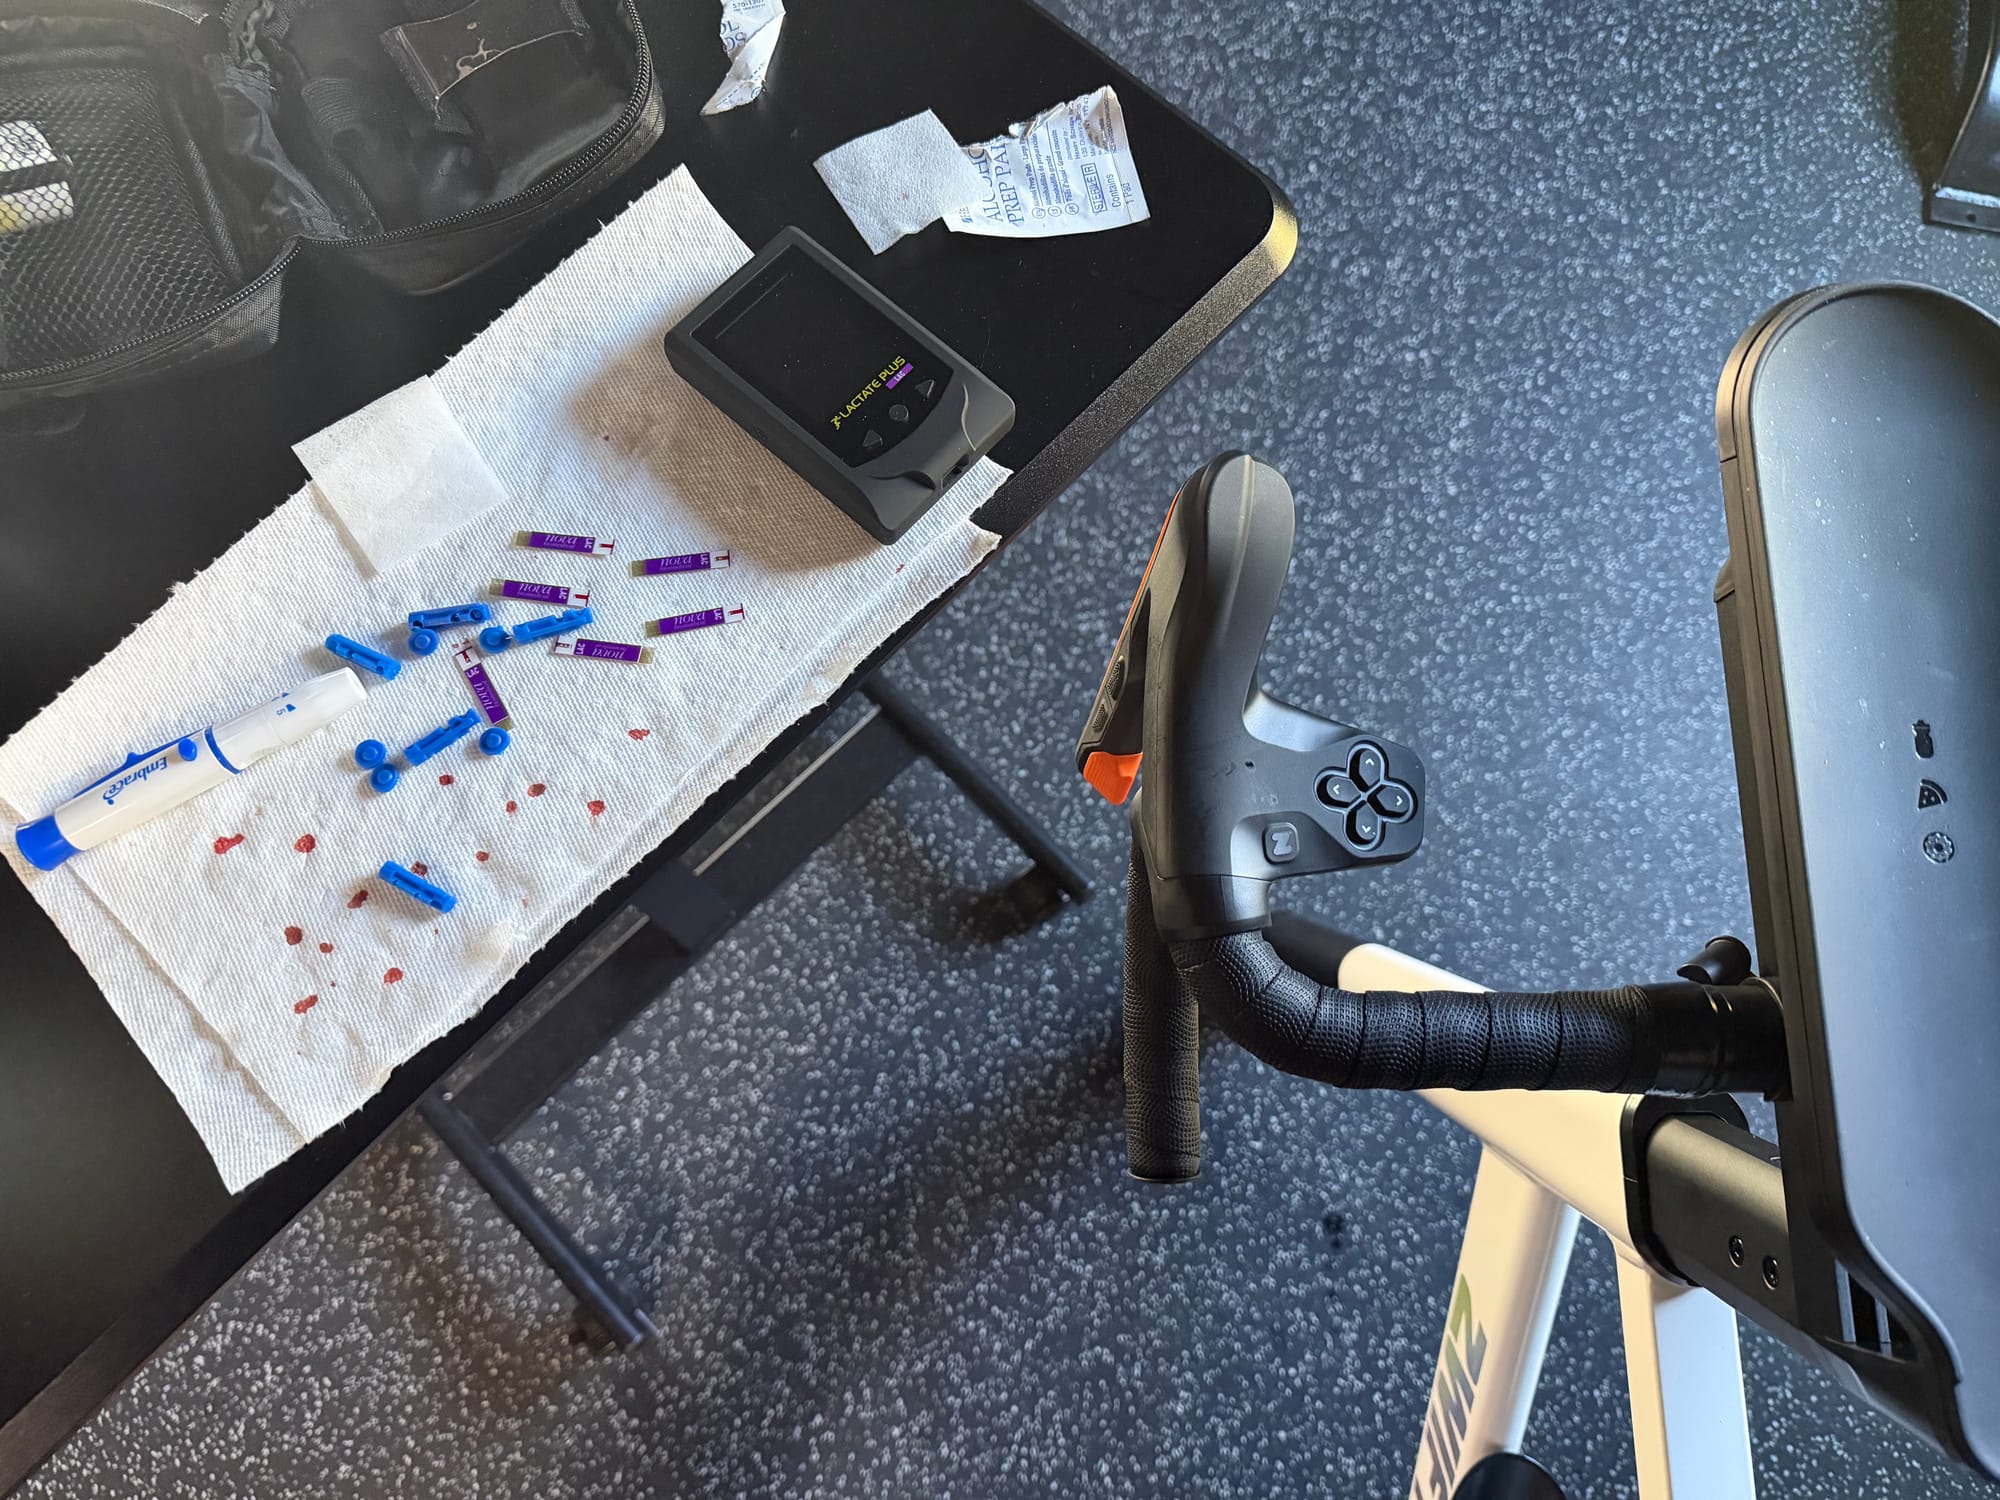
| BIS (general) | Athletic males, n=32, same-day | FM | ~841 g | 2,331 g | Farley (2021) |
| BIS (general) | Athletic males, same-day | FFM | ~822 g | 2,276 g | Farley (2021) |
| 10 BIA devices† | Healthy adults, n=73 | %BF | PE 0.14–0.49% | 0.38–1.36% | Siedler (2022) |
|
InBody 230 ≈ InBody 770
Portable 230 is nearly indistinguishable from research-grade 770 on precision (Nickerson 2020)
|
No InBody 380 data exists
No published precision study for this model. Expect performance between 230 and 770.
|
Maybe the most damning sub-analysis I have ever done. BIA in unstandardized to unstandardized conditions is worse than worthless.
|
ICC reported
0.994
|
→ |
Actual field LSC
4.72 kg
|
An ICC of 0.994 for total fat sounds nearly perfect — but it translates to a field LSC of 4.72 kg. The ICC is inflated by pooling men + women (huge between-subject variance). The SD of differences is the actionable number. |
Field PE = SD_diff / √2 → Field LSC (95%) = 2.77 × PE = 1.96 × SD_diff| Compartment | Unit | ICC | SD_diff | Field PE | Field LSC | Meaning |
|---|---|---|---|---|---|---|
| Arm fat | kg | 0.995 | 0.43 | 0.30 | 0.84 | > 0.8 kg = real |
| Leg fat | kg | 0.990 | 0.78 | 0.55 | 1.53 | > 1.5 kg = real |
| Trunk fat | kg | 0.993 | 1.48 | 1.05 | 2.90 | > 2.9 kg = real |
| Relative %BF | % | 0.993 | 1.28 | 0.91 | 2.51 | > 2.5% BF = real |
| VAT | cm² | 0.993 | 6.23 | 4.41 | 12.2 | > 12 cm² = real |
| Total fat | kg | 0.994 | 2.41 | 1.70 | 4.72 | > 4.7 kg = real |
| Total FFM | kg | 0.994 | 4.08 | 2.89 | 7.99 | > 8.0 kg = real |
| TBW | L | 0.995 | 2.59 | 1.83 | 5.07 | > 5.1 L = real |
| ICW | L | 0.996 | 1.57 | 1.11 | 3.08 | > 3.1 L = real |
| ECW | L | 0.993 | 1.12 | 0.79 | 2.19 | > 2.2 L = real |
Let's cherry-pick the other way...kind of.
| Method | Category | ICC | TEM (kg) | LSC (kg) | %CV |
|---|---|---|---|---|---|
| BIS (SFB7) | Bioimpedance | 1.000 | 0.04 | 0.11 | 0.09% |
| Seca mBCA 515 | MF-BIA | 1.000 | 0.14 | 0.39 | 0.26% |
| InBody 770 | MF-BIA | 1.000 | 0.19 | 0.53 | 0.37% |
| SFBIA (RJL) | SF-BIA | 0.999 | 0.30 | 0.83 | 0.56% |
| Non-bioimpedance comparators | |||||
| DXA (GE Lunar) | X-ray | 0.999 | 0.42 | 1.16 | 0.76% |
| 4C model | Criterion | 0.999 | 0.44 | 1.22 | 0.83% |
| ADP (BOD POD) | Plethysmography | 0.999 | 0.47 | 1.30 | 0.90% |
| 3DO Styku | 3D scan | 0.999 | 0.41 | 1.14 | 0.73% |
| 3DO SizeStream | 3D scan | 0.997 | 0.58 | 1.61 | 1.11% |
| 3DO Fit3D | 3D scan | 0.999 | 0.88 | 2.44 | 0.75% |
| DoD/Army eq. | Anthropometry | 0.994 | 0.93 | 2.58 | 1.55% |
|
BIS « standing BIA
Supine BIS TEM is 3–5× lower than standing MF-BIA for FM and FFM. This reflects the supine electrode protocol eliminating postural fluid shifts.
|
InBody 770 ≈ Seca mBCA
Both research-grade octapolar devices produce sub-0.6 kg LSC for FM and FFM. InBody 770 is slightly noisier for %BF (0.80 vs 0.55%).
|
|
BIA beats DXA on same-session precision
All 4 bioimpedance devices had lower same-session TEM than DXA for FM and FFM. DXA’s advantage appears in field/multi-day robustness, not technical repeatability.
|
3DO & anthropometry are noisiest
3D optical scanners and the DoD body-fat equation show the widest LSC ranges, likely due to posture variation and measurement site inconsistency.
|
All of them in one chart!
| Method | Sample | n | Sex | Measure | SEM / PE | LSC (95%) | Condition | Author (year) |
|---|---|---|---|---|---|---|---|---|
| DXA | ||||||||
| DXA | Resistance-trained athletes | 32 | M | FM | PE 435 g | 1,204 g | Same-day | Farley (2021) |
| DXA | Resistance-trained athletes | 32 | M | FM | PE 583 g | 1,615 g | Consec-day | Farley (2021) |
| DXA | Resistance-trained athletes | 32 | M | FFM | PE 527 g | 1,461 g | Same-day | Farley (2021) |
| DXA | Resistance-trained athletes | 32 | M | FFM | PE 710 g | 1,967 g | Consec-day | Farley (2021) |
| DXA | Resistance-trained athletes | 21 | M/F | FM | PE 660 g | 1,829 g | Same-day | Zemski (2019) |
| DXA | Resistance-trained athletes | 21 | M/F | FM | PE 1,261 g | 3,493 g | Consec-day | Zemski (2019) |
| DXA | Resistance-trained athletes | 21 | M/F | LM | PE 617 g | 1,709 g | Same-day | Zemski (2019) |
| DXA | Resistance-trained athletes | 21 | M/F | LM | PE 2,083 g | 5,770 g | Consec-day | Zemski (2019) |
| DXA (iDXA) | Healthy subjects | 30 | M/F | FM | CV 0.40–0.88% | 484 g | Same-day | Henriksen (2021) |
| DXA (iDXA) | Healthy subjects | 30 | M/F | LM | — | 618 g | Same-day | Henriksen (2021) |
| DXA (iDXA) | Active adults, unstd. | 117 | 86M/17F | %BF | SD 0.95% | 1.86% | Field | Potter (2025) |
| DXA (iDXA) | Active adults, unstd. | 117 | 86M/17F | FM | SD 0.61 kg | 1,190 g | Field | Potter (2025) |
| DXA (iDXA) | Active adults, unstd. | 117 | 86M/17F | FFM | SD 1.52 kg | 2,980 g | Field | Potter (2025) |
| BIA / BIS | ||||||||
| InBody 770 | Healthy adults | 67 | 31M/36F | %BF | SEM 0.77% | 2.13% | Same-day | Nickerson (2020) |
| InBody 770 | Healthy adults | 67 | 31M/36F | FM | SEM 0.54 kg | 1,500 g | Same-day | Nickerson (2020) |
| InBody 770 | Healthy adults | 67 | 31M/36F | FFM | SEM 0.58 kg | 1,610 g | Same-day | Nickerson (2020) |
| InBody 770 | Military, standardized | 14 | M/F | All comps | ICC ≥0.999 | ~0.6 kg | Same-day | Looney (2024) |
| InBody 770 | Active adults, unstd. | 117 | 100M/17F | %BF | SD 1.28% | 2.51% | Field | Potter (2025) |
| InBody 770 | Active adults, unstd. | 117 | 100M/17F | FM | SD 2.41 kg | 4,720 g | Field | Potter (2025) |
| InBody 770 | Active adults, unstd. | 117 | 100M/17F | FFM | SD 4.08 kg | 7,990 g | Field | Potter (2025) |
| InBody 370S | Healthy adults | 67 | 31M/36F | %BF | SEM 0.99% | 2.73% | Same-day | Nickerson (2020) |
| InBody 230 | Healthy adults | 67 | 31M/36F | %BF | SEM 0.82% | 2.27% | Same-day | Nickerson (2020) |
| BIS (general) | Athletic males | 32 | M | FM | ~841 g | 2,331 g | Same-day | Farley (2021) |
| BIS (general) | Athletic males | 32 | M | FM | ~1,302 g | 3,607 g | Consec-day | Farley (2021) |
| BIS (general) | Athletic males | 32 | M | FFM | ~822 g | 2,276 g | Same-day | Farley (2021) |
| BIS (general) | Athletic males | 32 | M | FFM | ~1,432 g | 3,966 g | Consec-day | Farley (2021) |
| 10 BIA devices† | Healthy adults | 73 | M/F | %BF | PE 0.14–0.49% | 0.38–1.36% | Same-day | Tinsley (2022) |
| 3D optical | ||||||||
| 3DO (4 scanners) | Healthy adults | 139 | M/F | %BF | RMS-CV 2.3–4.3% | ~6.4–11.9% | Same-day | Tinsley (2020) |
| 3DO (4 scanners) | Healthy adults | 139 | M/F | FM | RMS-CV 2.5–4.3% | ~6.9–11.9% | Same-day | Tinsley (2020) |
| 3DO (4 scanners) | Healthy adults | 139 | M/F | FFM | RMS-CV 0.7–1.4% | ~1.9–3.9% | Same-day | Tinsley (2020) |
| 3DO (Styku) | Healthy adults | 188 | 102F/86M | FM | RMSE 0.41 kg | ~1,140 g | Same-day | Shepherd (2021) |
| 3DO (Styku) | Healthy adults | 188 | 102F/86M | %BF | RMSE 0.60% | ~1.66% | Same-day | Shepherd (2021) |
| 3DO (shape PCs) | Healthy adults | 407 | M/F | FM | RMSE 0.81 kg (M) | ~1.8–2.2 kg | Same-day | Heymsfield (2019) |
| 3DO+BIA (5C) | Adults + athletes | 67 | 31F/36M | FFM | RMSE 0.73 kg | ~2,020 g | Same-day | Graybeal (2023) |
| 3DO (Fit3D) | Intervention studies | 133 | 45F/88M | FM change | RMSE 1.98–2.31 kg | — | Field | Harty (2022) |
| Skinfolds | ||||||||
| Skinfolds (SA) | Athletic males | 32 | M | FM | — | 586 g | Same-day | Farley (2021) |
| Skinfolds (SA) | Athletic males | 32 | M | FM | — | 442 g | Consec-day | Farley (2021) |
| Skinfolds (SA) | Athletic males | 32 | M | FFM | — | 568 g | Same-day | Farley (2021) |
| Skinfolds (SA) | Athletic males | 32 | M | FFM | — | 1,159 g | Consec-day | Farley (2021) |
| Skinfolds (caliper) | Healthy adults | 49 | M/F | %BF | SEM 0.63% | ~1.75% | Same-day | Totosy de Zepetnek (2021) |
| Skinfolds (inter-rater) | Mixed | 20 | M/F | %BF | ICC 0.62–0.91 | Variable | Same-day | Lohman (1987) |
| Ultrasound | ||||||||
| B-mode US (IOC) | Elite athletes | 76 | 39F/37M | Σ8 SAT | LOA 1.2 mm | ~0.2 kg FM | Field | Wagner (2019) |
| A-mode US (BM) | Healthy adults | 144 | 81M/63F | %BF | TEM 0.89–1.07% | 2.47–3.43% | Same-day | Júnior (2020) |
| A-mode US (BM) | NCAA D-I athletes | 45 | 22M/23F | %BF | ICC ≥0.996 | TE 4.4% | Same-day | Smith-Ryan (2016) |
| A-mode US (BM) | Healthy adults | 49 | M/F | %BF | SEM 0.78% | ~2.16% | Same-day | Totosy de Zepetnek (2021) |
| US (novice inter-rater) | College students | 80 | 48M/32F | %BF | ICC 0.975–0.990 | — | Same-day | Rodriguez (2020) |
| MRI | ||||||||
| MRI (3T Dixon) | Postmenopausal women | 36 | F | Fat comps | CV 1.1–1.5% | — | Same-day | West (2018) |
| MRI (3T Dixon) | Postmenopausal women | 36 | F | Muscle groups | CV 0.8–1.9% | — | Same-day | West (2018) |
| MRI (multi-scanner) | Healthy adults | 18 | M/F | VAT | Rep. 13 cL | Repro. 24 cL | Same-day | Leinhard (2020) |
| MRI (multi-scanner) | Healthy adults | 18 | M/F | Thigh muscle | Rep. 17 cL | Repro. 31 cL | Same-day | Leinhard (2020) |
| MRI (UK Biobank) | Adults | 4,905 | M/F | VAT/SAT/SM | CoV ≤3.8% | ICC ≥0.96 | Same-day | Wilkinson (2025) |
| MRI (0.55T) | Healthy adults | 10 | 5M/5F | VAT | CV 2.2% | Rep. 11.8 cL | Same-day | Chaudhari (2023) |
If you are an athlete, a lot of these studies are not you, and the modeling equations are not built on data that represents you. So below is a calculator that you can use to calculate your own technical and biological variance. It involves taking two back-to-back measurements for at least five days.
I would run some iteration of this on both sides of an intervention, which we have covered HERE in an Excel sheet.
|
Compartment label
|
Unit
|
Confidence
|
| Day | Scan 1 | Scan 2 | Diff | |
| 1 | — | |||
| 2 | — | |||
| 3 | — | |||
| 4 | — | |||
| 5 | — | |||
| 6 | — | |||
| 7 | — | |||
| 8 | — | |||
| 9 | — | |||
| 10 | — |
Additionally, a lot of people also aren't running these on standardized conditions even when they might think they are. If you run body comp testing at the end of a cut compared to the beginning and carb intake is not the same...not the same conditions. In this scenario, if you are attempting to pick up small changes, I would recommend spending some time refeeding to maintenance before re-testing.
So can you trust bioimpedance to measure your body fat percentage?
Perhaps, and it depends on your use case/degree of change, your ability to standardize the measurement, and the device in question.
TL;DR - You can use this article as a place to start when assessing how and when to use different body composition assessment technologies based on your potential adaptation and the time domain. The goal of this entire deep dive was to help people bring intentionality to how they collect and interpret this data. Whenever possible, I would recommend calculating one's own LSC based on how stable the metric is for them and utilizing raw data over models that are likely not built on an athletic population.
REFERENCES:
Chaudhari AS, Huo D, Broseus A, et al. Low-field MRI body composition: validation against 3.0T and potential for broad clinical use. Magn Reson Med. 2023;90(4):1478-1492. doi:10.1002/mrm.29746
Farley A, Slater GJ, Hind K. Short-term precision error of body composition assessment methods in resistance-trained male athletes. Int J Sport Nutr Exerc Metab. 2021;31(1):55-65. doi:10.1123/ijsnem.2020-0061
Graybeal AJ, Brandner CF, Engel AK, et al. Combining three-dimensional optical imaging and bioelectrical impedance analysis: validation of a novel five-component body composition model. Clin Nutr. 2023;42(11):2171-2179. doi:10.1016/j.clnu.2023.09.011
Harshman SG, Hall KD, Engel AK, et al. Validation of bioelectrical impedance analysis for body composition assessment in children with obesity. J Clin Densitom. 2024;27(2):101478. doi:10.1016/j.jocd.2024.101478
Harty PS, Sieglinger B, Rodriguez C, et al. Comparison of three-dimensional optical scanning for longitudinal body composition assessment. Am J Clin Nutr. 2022;115(3):874-884. doi:10.1093/ajcn/nqab381
Henriksen HB, Alavi DH, Blomhoff R. Precision of Lunar dual-energy X-ray absorptiometry (iDXA) in measuring body composition among colorectal cancer patients and healthy subjects. Clin Nutr ESPEN. 2021;44:443-449. doi:10.1016/j.clnesp.2021.05.016
Heymsfield SB, Bourgeois B, Ng BK, Sommer MJ, Li J, Shepherd JA. Digital anthropometry: a critical review. Eur J Clin Nutr. 2018;72(5):680-687. doi:10.1038/s41430-017-0072-0
Hind K, Slater G, Oldroyd B, et al. Interpretation of dual-energy X-ray absorptiometry-derived body composition change in athletes: a review and recommendations for best practice. J Clin Densitom. 2018;21(3):429-443. doi:10.1016/j.jocd.2018.01.002
Kasper AM (Herberts T, Slater GJ, Farley A, Hogarth L, Areta JL, Paulsen G, Garthe I). Protocol standardization may improve precision error of InBody 720 body composition analysis. Int J Sport Nutr Exerc Metab. 2023;33(4):222-229. doi:10.1123/ijsnem.2022-0219
Leinhard OD (Borga M, Ahlgren A, Romu T, Widholm P, Dahlqvist Leinhard O, West J). Reproducibility and repeatability of MRI-based body composition analysis. Magn Reson Med. 2020;84(6):3146-3156. doi:10.1002/mrm.28387
Lohman TG. Skinfolds and body density and their relation to body fatness: a review. Hum Biol. 1981;53(2):181-225.
Looney DP, Schafer EA, Chapman CL, Pryor RR, Potter AW, Roberts BM, Friedl KE. Reliability, biological variability, and accuracy of multi-frequency bioelectrical impedance analysis for measuring body composition components. Front Nutr. 2024;11:1491931. doi:10.3389/fnut.2024.1491931
McLester CN, Nickerson BS, Kliszczewicz BM, McLester JR. Reliability and agreement of various InBody body composition analyzers as compared to dual-energy X-ray absorptiometry in healthy men and women. J Clin Densitom. 2020;23(3):443-450. doi:10.1016/j.jocd.2018.10.008
Miclos-Balica M, Muntean P, Schick F, et al. Reliability of body composition assessment using A-mode ultrasound in a heterogeneous sample. Eur J Clin Nutr. 2021;75:482-488. doi:10.1038/s41430-020-00743-y
Potter AW, Nindl LJ, Soto LD, et al. Multi-frequency bioelectrical impedance analysis as a surrogate for dual-energy X-ray absorptiometry body composition assessment: a military field study. US Army USARIEM Technical Report. 2025.
Rodriguez C (Wagner DR, Teramoto M). Interrater reliability of novice examiners using A-mode ultrasound and skinfolds to measure subcutaneous body fat. PLoS One. 2020;15(12):e0244019. doi:10.1371/journal.pone.0244019
Shepherd JA, Ng BK, Sommer MJ, et al. Body composition by DXA and 3D optical surface scanning. Obesity (Silver Spring). 2021;29(8):1377-1385. doi:10.1002/oby.23199
Shepherd JA, Sommer MJ, Engel AK, et al. Smartwatch bioelectrical impedance analysis for body composition assessment. Eur J Clin Nutr. 2022;76(11):1586-1593.
Siedler MR, Rodriguez C, Stratton MT, et al. Assessing the reliability and cross-sectional and longitudinal validity of fifteen bioelectrical impedance analysis devices. Br J Nutr. 2023;130(5):827-840. doi:10.1017/S0007114522003749
Smith-Ryan AE, Blue MNM, Trexler ET, Hirsch KR. Utility of ultrasound for body fat assessment: validity and reliability compared to a multicompartment criterion. Clin Physiol Funct Imaging. 2018;38(2):220-226. doi:10.1111/cpf.12402
Tinsley GM, Harty PS, Stratton MT, Smith RW, Rodriguez C, Siedler MR. Tracking changes in body composition: comparison of methods and influence of pre-assessment standardisation. Br J Nutr. 2022;127(11):1656-1674. doi:10.1017/S0007114521002579
Tinsley GM, Moore ML, Benavides ML, et al. 3-Dimensional optical scanning for body composition assessment: a 4-component model comparison of four commercially available scanners. Clin Nutr. 2020;39(10):3160-3167. doi:10.1016/j.clnu.2020.02.008
Toselli S, Campa F, Maietta Latessa P, et al. Accuracy and reliability of the InBody 270 multi-frequency body composition analyser in 10-12-year-old children. PLoS One. 2021;16(3):e0248304. doi:10.1371/journal.pone.0248304
Totosy de Zepetnek JO, Lee JJ, Boateng T, et al. Test-retest reliability and validity of body composition methods in adults. Clin Physiol Funct Imaging. 2021;41(5):417-425. doi:10.1111/cpf.12716
Uchida K, et al. Reliability of segmental bioelectrical impedance analysis with InBody S10 in healthy adults. 2025.
Wagner DR, Teramoto M. B-mode ultrasound body composition assessment: IOC protocol precision in elite athletes. Sports Med. 2019;49(4):533-543.
West J, Romu T, Thorell S, et al. Precision of MRI-based body composition measurements of postmenopausal women. PLoS One. 2018;13(2):e0192495. doi:10.1371/journal.pone.0192495
Wilkinson T, et al. Automated MRI body composition quantification in the UK Biobank imaging study. Abdom Radiol. 2025.
Zemski AJ, Hind K, Keating SE, Broad EM, Marsh DJ, Slater GJ. Same-day vs consecutive-day precision error of dual-energy X-ray absorptiometry for interpreting body composition change in resistance-trained athletes. J Clin Densitom. 2019;22(1):104-114. doi:10.1016/j.jocd.2018.10.005

Related Content
Revisiting Diet-Induced Muscle Loss.
Feb 14, 2026
Nutrition Is Responsible For What Percentage Of Fat Loss Results?
Feb 04, 2026
New Thoughts On Goal Setting and Behavior Change
Jan 02, 2026