

In industrialized nations, ultra-processed foods (UPFs) tend to make up ~61-84% of our caloric intake [1, 2].
UPF consumption is related to an increased risk of obesity, cardiovascular disease, type 2 diabetes, hypertension, cancer, irritable bowel syndrome, depression, metabolic syndrome, and even death [3-7].*
The consumption of UPFs also likely leads to an unknown increase in calories and weight gain and moving to a diet of primarily whole foods likely leads to subconsciously eating hundreds, maybe even thousands of calories less...and perhaps independent weight loss [8].
OK…but, what are Ultra-Processed Foods?
The most prominent classification of UPFs is NOVA (not an acronym) [9, 10]. This classification system has multiple groupings for the degree of processing, but IMO it is ultimately not specific enough for our modern food environment.
The problem with NOVA is that it tends to leave people with a very simple narrative about food processing overall - “BAD”.
BUT, humans have been processing and cooking our food for hundreds of thousands of years and cooking/processing food is likely one of the main reasons that our brains expanded and our species took over the world [11]. All human societies cook and without complex food processing methodologies many hunter-gather tribes would not have survived [12-14].
“Evidence that present-day humans cannot extract sufficient energy from uncooked wild diets, whether or not they include meat, has led to the hypothesis that hunter-gatherers are biologically committed to the benefits of cooking.” -Carmody et al., 2016 [14]
Given that the majority of the food we eat is processed or cooked to some degree it is generally unhelpful to think of food processing as myopically BAD.
A better question is how much processing is potentially too much processing?
This is where the new SIGA classification system can potentially be more helpful (although not perfect), especially when we combine it with the concept of energy density.
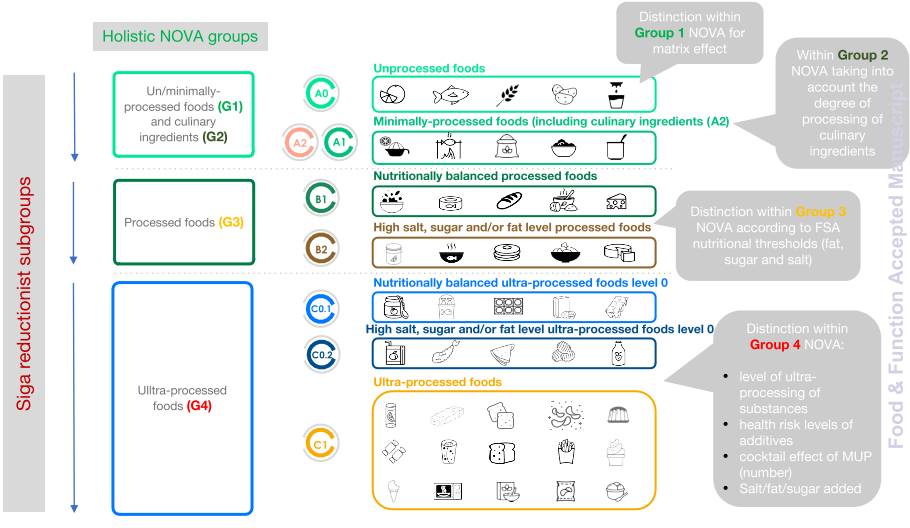
If you take a look at the chart above, unlike NOVA, Siga has more categories and also has objective quantifiable differences between these categories. We can also see that we probably want the bulk the food we consume to come from the A categories and B categories. Additionally, you will notice that when most people grocery shop they generally turn A0 and A1 foods into B1 or B2 meals.
Now what is the difference between the Bs and Cs or Processed vs. Ultra-Processed Foods?
Siga uses the following thresholds of
- 1.5 g salt/100 g, 12.5 g sugars/100 g and 17.5 g fat/100 g for foods and,
- 0.75 g salt/100 g, 6.25 g sugars/100 g and 8.75 g fat/100 g for beverages
The best way to get a grasp on this concept is to look at a nutrition label.
Let’s roll with a generic bag of potato chips.
All we have to do is take the data below and calculate the per 100 gram information.
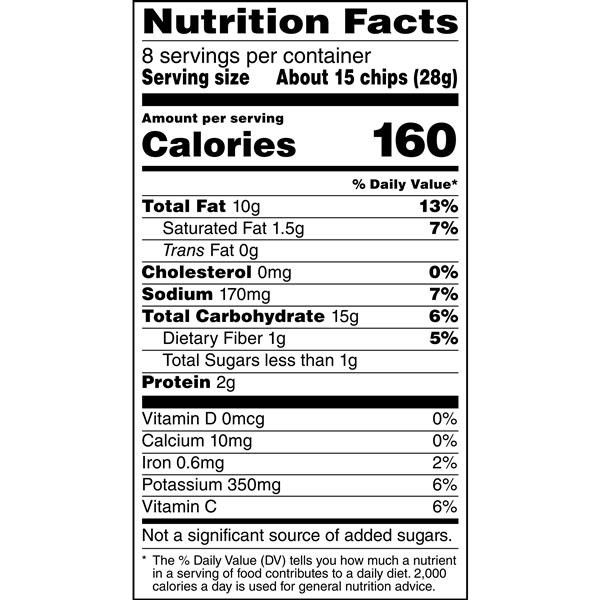
Salt = 607 mg per 100 grams
Added Sugar = less than 3 grams per 100 grams
BUT, then BAM...
Fat = 35.7 grams per 100 grams
AKA C1 - UPF
Most normal potato chips will be above 30 grams of fat per 100 grams, even the faux healthy chips and thus the vast the majority of them regardless of the marketing are UPFs!
Now, let’s look at a regular soda.
It has no fat and the sodium, in general, will be fairly low, but the sugar clocks in at about ~10 grams of sugar per 100 grams
AKA C1 - UPF Beverage
Now here is one of my beefs with SIGA – Gatorade almost sneaks in at 6.5 g of sugar per 100 grams **
Thus, I would add a stipulation that I don’t think it is a good idea to get more than 10 to 20% of your energy intake from liquid calories as they are generally not as satiating as solid food forms [15].
These general food classification systems also lack nuance and individualization, as the average athlete tends to lose 1-2 grams of sodium per hour and some lose much more [16, 17], thus these individuals may by definition need C1 foods or beverages!
Another pitfall of Siga is that some problematic extremely carbohydrate-heavy and energy-dense foods without a lot of fat could potentially sneak into the Bs.
Therefore, I would also add in one more overarching classification to this framework and that would be an Energy Density lower than 1.5 kcals per gram as I think this may be the threshold where people can regulate their caloric intake without thinking [18-20]. (I try not to be overly bullish with this ideology as it comes from mechanistic research and Hall's famous short-term cross-over design study cited above. In other words, we need more research!)
“Consistent with the concept of 'evolutionary discordance,' this work indicates that modern human physiology is poorly adapted to evaluate foods that have a historically unusual (high) energy density.”
-Brunstrom et al., 2018 [19]
We likely subconsciously cannot regulate our intake of these ultra-processed hyper-palatable foods very well, especially when we encounter a variety of them [21].
As a species, we have opened Pandora’s box of ceaselessly delicious UPFs and we can’t put them back in, and to wish for such a world is fantasy.
Personally, I don’t think of hyper-palatable Ultra-Processed Foods as Bad or Good, and in general, I think being rigid, entitled, and judgmental here is unhelpful, especially in children and adolescent populations where they are likely not even responsible for their families’ food buying practices. And...
“These findings suggest that restrictive or overly controlling feeding practices may contribute to the development of dietary restraint and disinhibition in young girls, ultimately impeding their ability to self-regulate their eating.” -Kral and Rauh 2011 [22]
I think that much like added sugar we are likely going to find a threshold effect where things get pretty terrible [23-25]. For most people, not actively trying to lose weight, I think it is fair to assume that this threshold will likely be between 10 to 20% of calories and above this threshold weight gain, chronic disease risk, and micronutrient deficiencies will likely be more probable.
Thus, what are we going to do?
This is where we get into Approach vs. Avoidance mindsets and I think the evidence here leans in favor of decreasing the ease of access and the stockpiling of UPFs [26, 27] while increasing the consumption of lower energy-dense foods [21, 28, 29] without creating good vs. bad narratives around food [30].
I also think that we are going to have more leeway and potentially more regulation of our appetite when we take the UPF confounder of sedentary behavior out of the equation [31-35].
Additionally, having more muscle mass will likely give you more calories to work with which I believe will be protective in our current obesogenic environment [36-38].
TL;DR – Ultra-Processed Foods are definitely a problem, but likely so is thinking of them myopically as BAD. The key to navigating our current food environment on the individual level seems to be finding what works for us. This could be a more rigid mindset around these types of foods at certain time points or it could be maintaining them below a certain threshold of energy intake. Higher levels of movement and muscle probably give us a bit more leeway with UPFs.
*Remember these are population-level associations and we would expect many of these findings as UPFs will likely cluster with other unhealthy user bias variables at the macro level. When you pull out UPF consumption you are likely pulling out socioeconomic status, race, food environment (swamps), etc and it is borderline impossible for epidemiological studies to untangle these confounders [39, 40].
Also, the relationship between UPFs and lower socioeconomic status may not hold in non-industrialized countries where these imported items can be much more expensive [41]. This was what I believe I saw in Costa Rica, where because of importation taxes UPFs from abroad were far more expensive than whole foods and these UPFs seemed to have a unique status symbol surrounding them.
Below is a quote I found interesting on the complexities of this issue (albeit likely a bit biased towards the more external locus of control side of this argument).
“A study from Spain found that an isoenergetic substitution of UP food with unprocessed or minimally processed foods was associated with a significant drop in mortality. At least 28 % of lives would be saved (on paper) if the current consumption of UP foods could be reduced from the highest quartile (68 % of energy) to the lowest quartile (48 % of energy). Whether such a reduction would be associated with a higher per energy diet cost to the affected consumer was not mentioned.
The present analyses can provide some answers. In the present sample, a reduction in the consumption of UP foods from 67·5% of energy (1st decile) to 48% of energy (10th decile) was associated with a mean increase in estimated diet costs from $216.40 (1st decile) to $369.90 (10th decile). A $153 increase in monthly diet costs would translate into $7,368 per year for a family of four. Clearly, there are economic reasons why lower-income people select low-cost energy-dense foods as opposed to the recommended ‘prudent’ options. What is not clear is that the association between social class and diet quality can be manipulated at will. In the present data, a 10 % drop in energy from UP foods was also associated with an additional $45,169.70 increase in mean residential property values at the tax parcel level.
For the most part, studies have tended to view the consumption of UP foods as a matter of individual choice. Researchers have taken the position that continuing the promotion of fresh and minimally processed foods should be the main policy to improve global public health. Suggestions for public health interventions generally ran towards consumer education, improved labeling, taxation, and marketing restrictions. It may be time to focus attention on why people turn to low-cost energy-dense foods in times of economic hardship and stress.”
-Gupta et al., 2021 [42]
REFERENCES:
1. Poti, J.M., B. Braga, and B. Qin, Ultra-processed Food Intake and Obesity: What Really Matters for Health-Processing or Nutrient Content? Curr Obes Rep, 2017. 6(4): p. 420-431.
2. Khandpur, N., et al., Ultra-Processed Food Consumption among the Paediatric Population: An Overview and Call to Action from the European Childhood Obesity Group. Ann Nutr Metab, 2020. 76(2): p. 109-113.
3. Chen, X., et al., Consumption of ultra-processed foods and health outcomes: a systematic review of epidemiological studies. Nutr J, 2020. 19(1): p. 86.
4. Elizabeth, L., et al., Ultra-Processed Foods and Health Outcomes: A Narrative Review. Nutrients, 2020. 12(7).
5. Rauber, F., et al., Ultra-processed food consumption and indicators of obesity in the United Kingdom population (2008-2016). PLoS One, 2020. 15(5): p. e0232676.
6. Davidou, S., et al., The holistico-reductionist Siga classification according to the degree of food processing: an evaluation of ultra-processed foods in French supermarkets. Food Funct, 2020. 11(3): p. 2026-2039.
7. Fardet, A., Characterization of the Degree of Food Processing in Relation With Its Health Potential and Effects. Adv Food Nutr Res, 2018. 85: p. 79-129.
8. Hall, K.D., et al., Ultra-Processed Diets Cause Excess Calorie Intake and Weight Gain: An Inpatient Randomized Controlled Trial of Ad Libitum Food Intake. Cell Metab, 2019. 30(1): p. 226.
9. Monteiro, C.A., et al., Ultra-processed foods: what they are and how to identify them. Public Health Nutr, 2019. 22(5): p. 936-941.
10. Monteiro, C.A., et al., The UN Decade of Nutrition, the NOVA food classification and the trouble with ultra-processing. Public Health Nutr, 2018. 21(1): p. 5-17.
11. Furness, J.B. and D.M. Bravo, Humans as cucinivores: comparisons with other species. J Comp Physiol B, 2015. 185(8): p. 825-34.
12. Henrich, J., Human Cooperation: The Hunter-Gatherer Puzzle. Curr Biol, 2018. 28(19): p. R1143-R1145.
13. Henrich, J., The Secret of Our Success: How Culture Is Driving Human Evolution, Domesticating Our Species, and Making Us Smarter. 2015: Princeton University Press. 464
14. Carmody, R.N., et al., Genetic Evidence of Human Adaptation to a Cooked Diet. Genome Biol Evol, 2016. 8(4): p. 1091-103.
15. Pan, A. and F.B. Hu, Effects of carbohydrates on satiety: differences between liquid and solid food. Curr Opin Clin Nutr Metab Care, 2011. 14(4): p. 385-90.
16. Barnes, K.A., et al., Normative data for sweating rate, sweat sodium concentration, and sweat sodium loss in athletes: An update and analysis by sport. J Sports Sci, 2019. 37(20): p. 2356-2366.
17. Lara, B., et al., Interindividual variability in sweat electrolyte concentration in marathoners. J Int Soc Sports Nutr, 2016. 13: p. 31.
18. Rolls, B.J., Dietary energy density: Applying behavioural science to weight management. Nutr Bull, 2017. 42(3): p. 246-253.
19. Brunstrom, J.M., et al., Undervalued and ignored: Are humans poorly adapted to energy-dense foods? Appetite, 2018. 120: p. 589-595.
20. Small, D.M. and A.G. DiFeliceantonio, Processed foods and food reward.Science, 2019. 363(6425): p. 346-347.
21. Raynor, H.A. and M. Vadiveloo, Understanding the Relationship Between Food Variety, Food Intake, and Energy Balance. Curr Obes Rep, 2018. 7(1): p. 68-75.
22. Kral, T.V. and E.M. Rauh, Eating behaviors of children in the context of their family environment. Physiol Behav, 2010. 100(5): p. 567-73.
23. Fulgoni, V.L., 3rd, et al., Association of Added Sugars Intake with Micronutrient Adequacy in US Children and Adolescents: NHANES 2009-2014.Curr Dev Nutr, 2019. 3(12): p. nzz126.
24. Rennie, K.L. and M.B. Livingstone, Associations between dietary added sugar intake and micronutrient intake: a systematic review. Br J Nutr, 2007. 97(5): p. 832-41.
25. USDA, Dietary Guidelines for Americans 2020-2025. 2021: USDA.
26. Hollands, G.J., et al., Altering the availability or proximity of food, alcohol, and tobacco products to change their selection and consumption.Cochrane Database Syst Rev, 2019. 8: p. CD012573.
27. Poelman, M.P., et al., Behavioural strategies to control the amount of food selected and consumed. Appetite, 2014. 72: p. 156-65.
28. Vadiveloo, M., H. Parker, and H. Raynor, Increasing low-energy-dense foods and decreasing high-energy-dense foods differently influence weight loss trial outcomes. Int J Obes (Lond), 2018. 42(3): p. 479-486.
29. Cavallo, D.N., M. Horino, and W.J. McCarthy, Adult Intake of Minimally Processed Fruits and Vegetables: Associations with Cardiometabolic Disease Risk Factors. J Acad Nutr Diet, 2016. 116(9): p. 1387-1394.
30. Palascha, A., E. van Kleef, and H.C. van Trijp, How does thinking in Black and White terms relate to eating behavior and weight regain? J Health Psychol, 2015. 20(5): p. 638-48.
31. Shook, R.P., et al., Low levels of physical activity are associated with dysregulation of energy intake and fat mass gain over 1 year.Am J Clin Nutr, 2015. 102(6): p. 1332-8.
32. Blundell, J.E., et al., Appetite control and energy balance: impact of exercise. Obes Rev, 2015. 16 Suppl 1: p. 67-76.
33. Beaulieu, K., et al., Homeostatic and non-homeostatic appetite control along the spectrum of physical activity levels: An updated perspective.Physiol Behav, 2018. 192: p. 23-29.
34. Fearnbach, S.N., et al., Impact of imposed exercise on energy intake in children at risk for overweight. Nutr J, 2016. 15(1): p. 92.
35. Ajibewa, T.A., et al., The effects of interrupting prolonged sitting with intermittent activity on appetite sensations and subsequent food intake in preadolescent children. PLoS One, 2017. 12(12): p. e0188986.
36. Hopkins, M., et al., Modelling the associations between fat-free mass, resting metabolic rate and energy intake in the context of total energy balance. Int J Obes (Lond), 2016. 40(2): p. 312-8.
37. Blundell, J.E., et al., The drive to eat in homo sapiens: Energy expenditure drives energy intake. Physiol Behav, 2020. 219: p. 112846.
38. Wells, J.C., et al., The “drive to eat” hypothesis: energy expenditure and fat-free mass but not adiposity are associated with milk intake and energy intake in 12 week infants. The American Journal of Clinical Nutrition, 2021. 114(2): p. 505-514.
39. Baraldi, L.G., et al., Consumption of ultra-processed foods and associated sociodemographic factors in the USA between 2007 and 2012: evidence from a nationally representative cross-sectional study. BMJ Open, 2018. 8(3): p. e020574.
40. Cooksey-Stowers, K., M.B. Schwartz, and K.D. Brownell, Food Swamps Predict Obesity Rates Better Than Food Deserts in the United States. Int J Environ Res Public Health, 2017. 14(11).
41. Simoes, B.D.S., et al., Consumption of ultra-processed foods and socioeconomic position: a cross-sectional analysis of the Brazilian Longitudinal Study of Adult Health (ELSA-Brasil). Cad Saude Publica, 2018. 34(3): p. e00019717.
42. Gupta, S., et al., Characterising percentage energy from ultra-processed foods by participant demographics, diet quality and diet cost: findings from the Seattle Obesity Study (SOS) III. Br J Nutr, 2021. 126(5): p. 773-781.


Related Content
Is Hemoglobin A1c Useful In Athletes and How Is It Affected By Chronic Exercise?
May 28, 2025
Revisiting The Effect of Carbohydrate Timing and Low Energy Availability on Performance.
Jan 23, 2025
Can We Eat Carbohydrates and Be Healthy?
Mar 17, 2024